I wrote up a short and dirty script in order to archive out all the Zoneminder events as mpeg files.   The script goes through and identifies all the events and creates a mpeg video file for each day of footage per camera (monitor).  I found this was the best way to keep the event organized and able to look up a particular day and monitor the easiest.  This is sort of a work in progress though, and for one of the awk statements, I had trouble incorporating the variable, so you may need to change it up slightly.

A prerequisite is that you will need to have FFMPEG installed on your system.  You may also have to change some of the parameters to match your systems, such as where the root directory for the event image files are as well as adjusting for the number of EVENT_IMAGE_DIGITS you are using in your zoneminder options/configuration.  I use 5 digits, but I believe the default is set to 3, which limits your events to 999 images.  Anyway, here it is.

archive_all script (zipped)

Maybe you can find this useful.

One site that I manage that has a lot of complex disease-related data that is given out for free to the public directly via the web site and also via an iOS app.  The entire site is dynamic and derived from multiple back end sources and subsequently causes a bit of a hit to render the information together.  We have often seen other entities (IPs originating from China & Germany recently) decide they want to “scrape” the entire site for all of the content without throttling their connections.  Due to our limited resources (only two front-end application servers), when someone hits us this way, this effectively creates a minor DoS for us.   The best place to try to control for these sort of scenarios would of course be at the load balancer device, but I don’t have control of configuration of them and so I have had to try to take matters into my own hands.

While there are quite a number of ways to cap someone’s impact on your server (mod_bw, mod_ratelimit, IP Tables, etc), most often, these are rendered fairly useless by the client’s IP being replaced by the IP of the LTM (traffic manager / load balancer).

Here’s how I effectively was able to limit other entities ability to hit our site beyond what it could handle.

Step 1:  Install mod_security (and mod_unique if not already loaded) – my mod_security was version 2.7 on CentOS

Step 2: Create a basic config for mod security
########## MOD SEC Basic Config File ###########
LoadModule unique_id_module modules/mod_unique_id.so
LoadModule security2_module modules/mod_security2.so
SecRuleEngine On
SecDataDir /tmp
SecTmpDir /tmp
SecDebugLog /var/log/httpd_logs/modsec_debug.log
SecDebugLogLevel 0
##########################################

Step 3: Add the specific connection limiting configuration anywhere inside the VirtualHost directives of the site you are trying to protect:

####### SPECIFIC rate limiting for this site inside apache VirtualHost #########
<LocationMatch “^/(?!(?:jpe?g|png|bmp|gif|css|js|svg))(.*)”>
#counts everything but images and such
SecAction initcol:ip=%{X-Forwarded-For},pass,nolog,id:4444446
SecAction “phase:5,deprecatevar:ip.mysiteconncounter=1/1,pass,nolog,id:4444447”
SecRule IP:MYSITECONNCOUNTER “@gt 150” “id:4444448,phase:2,pause:300,deny,status:509,setenv:RATELIMITED,skip:1,nolog”
SecAction “id:4444449,phase:2,pass,setvar:ip.mysiteconncounter=+1,nolog”
Header always set Retry-After “15” env=RATELIMITED
</LocationMatch>
ErrorDocument 509 “Rate Limit Exceeded”
############## End rate limit configuration for virtual host here ###########

Step 4: Restart apache!

Some additional notes:
* You can limit what portion of your site is watched in the LocationMatch (instead of the whole site like I did)
* With Mod Security 2.7, I guess you need to add unique rule ID’s to each rule.  For these numbers I chose arbitrarily 4444446 – 4444449
* Change the “@gt 150” to a lower number if you want to lower the threshold for number of connections (each second the number of connections decreases by 1 for each IP) or the speed to which it deprecates the IP connection stat (1/1)
* If you would like to protect multiple sites (additional VirtualHosts on the same server), use a different variable for collecting IPs. In my case above I used “mysiteconncounter” so make sure it is something different, otherwise they will stomp on each other.
* You could probably return a different error code rather than 509 as it is only really partially supported out there.


Here’s a short little test that I worked up many years ago specifically for using for Linux SysOps candidates and I thought I would share it for anyone who would like to use it.  It measures a few things.  Firstly, of course, it tests for basic familiarity with Linux but more importantly, how well a candidate can follow instructions.  This is probably the most important trait to have where critical systems are involved and most of the operator actions are pre-scripted.  I have found the last part of the test on page 3 will identify detail-oriented candidates for you quite effectively and weed out the rest.  I’ve put it in PDF format so you can print it easily.

Click on the thumbnail below to download it.

Link for Linux Sys Ops test download
Click to download the Linux Sys Ops test (PDF format)

I’m sure the last part also can easily be adapted for other non-linux oriented roles that require good traits for focus, memory and precision.

I can post up the answer key, but really if you don’t already know the answers, you probably shouldn’t be administering this test!

I have a data center that I don’t physically visit very often.  Recently I’d replaced some UPS units that conveniently had some external temperature sensors on them which I used to use to monitor the environmental temperature.  One of my HVAC units does report temperature, but because it isn’t too close to the main equipment rack, I really wanted to know what sort of temperature my servers were experiencing directly in the rack.  I finally came up with a way to do this with some of my HP ProLiant DL360 G7s.  I used to do this with Dell’s that had built-in temperature sensors, but we don’t have any of them around any more.   The hardest part of the process was figuring out all the necessary drivers and agents required to get the sensors monitored and able to be queried by snmp on the HPs.

First thing you need to do is download and install the HP Health command line utility and snmp agents on your server that needs to be monitored.  I located them by going to http://www.hp.com and then Support > Put in “DL360 G7” as model > Linux > choose “Software – System Management”  category > Download both the HP SNMP Agents for Linux as well as the HP Health command line utility.

Then I installed them and some standard RHEL packages:

# rpm -ivh ./hp-health-10.10-1710.30.rhel6.x86_64.rpm
# rpm -ivh ./hp-snmp-agents-10.10-2732.25.rhel6.x86_64.rpm
# yum install net-snmp net-snmp-utils lm_sensors

** Don’t forget to edit the /etc/snmp/snmpd.conf file to allow only appropriate access **
I’m not going to detail these steps in particular as this is more generic setup that you find in the man pages, etc. However, you WILL need to source the dlmod for the HP agent as follows in the snmpd.conf file as shown below:

dlmod cmaX /usr/lib64/libcmaX64.so

– – Or you can alternatively run:
# /sbin/hpsnmpconfig

(And then chose to use existing snmpd.conf, or create a new one.  However, I found it easier to  simply add in the dynamic module as I did above.)

** Also, I ran through the sensors-detect in order to see if there was anything else I could monitor of interest
# sensors-detect

…and chose to update the config file when prompted “Do you want to overwrite /etc/sysconfig/lm_sensors? (YES/no): YES”

Once all that was done I gave the new services a clean start if they weren’t already running and made sure they start at boot time:
# /etc/init.d/hp-snmp-agents restart
# /etc/init.d/snmpd restart
# chkconfig snmpd on

Now for the fun part!

I searched around online and figured out the at the Health / thermal MIB OIDS start at: 1.3.6.1.4.1.232.6.2.6 -ish
and that temp Sensor locations by INTEGER can be identified as follows: (I was really only interested in the ambient “11” sensor for this project, but you could track whichever ones you really wanted)

Locations: other(1), unknown(2), system(3), systemBoard(4), ioBoard(5), cpu(6),
memory(7), storage(8), removableMedia(9), powerSupply(10), ambient(11),
chassis(12), bridgeCard(13)

So then, from using the SNMPWALK utility I was able to derive all the available sensor locations:
e.g.  snmpwalk -Of -c public -v 1 localhost 1.3.6.1.4.1.232.6.2.6.8

.iso.org.dod.internet.private.enterprises.232.6.2.6.8.1.3.1.1 = INTEGER: 11
.iso.org.dod.internet.private.enterprises.232.6.2.6.8.1.3.1.2 = INTEGER: 6
.iso.org.dod.internet.private.enterprises.232.6.2.6.8.1.3.1.4 = INTEGER: 7
.iso.org.dod.internet.private.enterprises.232.6.2.6.8.1.3.1.5 = INTEGER: 7
.iso.org.dod.internet.private.enterprises.232.6.2.6.8.1.3.1.7 = INTEGER: 7
.iso.org.dod.internet.private.enterprises.232.6.2.6.8.1.3.1.9 = INTEGER: 7
.iso.org.dod.internet.private.enterprises.232.6.2.6.8.1.3.1.11 = INTEGER: 7
.iso.org.dod.internet.private.enterprises.232.6.2.6.8.1.3.1.12 = INTEGER: 10
.iso.org.dod.internet.private.enterprises.232.6.2.6.8.1.3.1.13 = INTEGER: 10
.iso.org.dod.internet.private.enterprises.232.6.2.6.8.1.3.1.14 = INTEGER: 7
.iso.org.dod.internet.private.enterprises.232.6.2.6.8.1.3.1.15 = INTEGER: 6
.iso.org.dod.internet.private.enterprises.232.6.2.6.8.1.3.1.16 = INTEGER: 6
.iso.org.dod.internet.private.enterprises.232.6.2.6.8.1.3.1.17 = INTEGER: 7
.iso.org.dod.internet.private.enterprises.232.6.2.6.8.1.3.1.18 = INTEGER: 6
.iso.org.dod.internet.private.enterprises.232.6.2.6.8.1.3.1.19 = INTEGER: 3
.iso.org.dod.internet.private.enterprises.232.6.2.6.8.1.3.1.20 = INTEGER: 3
.iso.org.dod.internet.private.enterprises.232.6.2.6.8.1.3.1.21 = INTEGER: 3
.iso.org.dod.internet.private.enterprises.232.6.2.6.8.1.3.1.22 = INTEGER: 3
.iso.org.dod.internet.private.enterprises.232.6.2.6.8.1.3.1.23 = INTEGER: 3
.iso.org.dod.internet.private.enterprises.232.6.2.6.8.1.3.1.24 = INTEGER: 3
.iso.org.dod.internet.private.enterprises.232.6.2.6.8.1.3.1.25 = INTEGER: 3
.iso.org.dod.internet.private.enterprises.232.6.2.6.8.1.3.1.26 = INTEGER: 3
.iso.org.dod.internet.private.enterprises.232.6.2.6.8.1.3.1.27 = INTEGER: 8
.iso.org.dod.internet.private.enterprises.232.6.2.6.8.1.3.1.28 = INTEGER: 3

And what the current reading in Celsius of the sensor is:

.iso.org.dod.internet.private.enterprises.232.6.2.6.8.1.4.1.1 = INTEGER: 22
.iso.org.dod.internet.private.enterprises.232.6.2.6.8.1.4.1.2 = INTEGER: 40
.iso.org.dod.internet.private.enterprises.232.6.2.6.8.1.4.1.4 = INTEGER: 34
.iso.org.dod.internet.private.enterprises.232.6.2.6.8.1.4.1.5 = INTEGER: 33
.iso.org.dod.internet.private.enterprises.232.6.2.6.8.1.4.1.7 = INTEGER: 31
.iso.org.dod.internet.private.enterprises.232.6.2.6.8.1.4.1.9 = INTEGER: 32
.iso.org.dod.internet.private.enterprises.232.6.2.6.8.1.4.1.11 = INTEGER: 32
.iso.org.dod.internet.private.enterprises.232.6.2.6.8.1.4.1.12 = INTEGER: 34
.iso.org.dod.internet.private.enterprises.232.6.2.6.8.1.4.1.13 = INTEGER: 45
.iso.org.dod.internet.private.enterprises.232.6.2.6.8.1.4.1.14 = INTEGER: 29
.iso.org.dod.internet.private.enterprises.232.6.2.6.8.1.4.1.15 = INTEGER: 31
.iso.org.dod.internet.private.enterprises.232.6.2.6.8.1.4.1.16 = INTEGER: 31
.iso.org.dod.internet.private.enterprises.232.6.2.6.8.1.4.1.17 = INTEGER: 28
.iso.org.dod.internet.private.enterprises.232.6.2.6.8.1.4.1.18 = INTEGER: 40
.iso.org.dod.internet.private.enterprises.232.6.2.6.8.1.4.1.19 = INTEGER: 35
.iso.org.dod.internet.private.enterprises.232.6.2.6.8.1.4.1.20 = INTEGER: 37
.iso.org.dod.internet.private.enterprises.232.6.2.6.8.1.4.1.21 = INTEGER: 43
.iso.org.dod.internet.private.enterprises.232.6.2.6.8.1.4.1.22 = INTEGER: 45
.iso.org.dod.internet.private.enterprises.232.6.2.6.8.1.4.1.23 = INTEGER: 40
.iso.org.dod.internet.private.enterprises.232.6.2.6.8.1.4.1.24 = INTEGER: 48
.iso.org.dod.internet.private.enterprises.232.6.2.6.8.1.4.1.25 = INTEGER: 36
.iso.org.dod.internet.private.enterprises.232.6.2.6.8.1.4.1.26 = INTEGER: 48
.iso.org.dod.internet.private.enterprises.232.6.2.6.8.1.4.1.27 = INTEGER: 35
.iso.org.dod.internet.private.enterprises.232.6.2.6.8.1.4.1.28 = INTEGER: 72

So, e.g. specifically looking at the “Ambient Sensor” we see a reading of 22 degrees Celsius (~71 deg F)
# snmpwalk -Of -c public -v 1  localhost 1.3.6.1.4.1.232.6.2.6.8.1.4.1.1
.iso.org.dod.internet.private.enterprises.232.6.2.6.8.1.4.1.1 = INTEGER: 22

Then on my Nagios server, I defined the new service and all the other params and restarted Nagios.  Below are the config files and custom commands I set up for this (your set up may be slightly different, but pretty close):

** /etc/nagios/conf.d/service_templates.cfg

define service {
register                0
use                     default-service
name                    hp_check_ambienttemp
service_description     HP Ambient Temperature
servicegroups           hpenv
check_command           snmp_hpenv_ambienttemp!public
}

** /etc/nagios/servers/servername.cfg

define host {
host_name    someservername
address        someservername.fqdn
hostgroups    acceptance
alias        Some HP DL360 G7 Server
use        server
}

define service {
host_name    someservername
use        ping,lowpriority
}

define service {
host_name        someservername
use            hp_check_ambienttemp,graph,critical
notifications_enabled     0
}

** /etc/nagios/conf.d/commands.cfg  (Note how I set 25 degrees as the warning threshold and 26 degrees as critical)

# ‘snmp_hpenv_ambienttemp’ command definition
define command {
command_name    snmp_hpenv_ambienttemp
command_line    $USER1$/check_snmp -H $HOSTADDRESS$ -C $ARG1$ -o .1.3.6.1.4.1.232.6.2.6.8.1.4.1.1 -w 25 -c 26 -l ‘\Ambient Air Temp\’ -u ‘\Celcius\’
}

** /etc/nagios/conf.d/servicegroups.cfg

define servicegroup {
servicegroup_name       hpenv
alias                   HP Server Envir Monitors
}

———

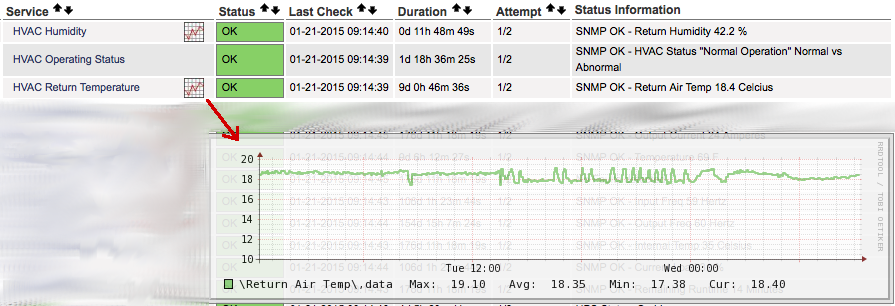
Here’s what the result is in Nagios.. (also, graphing is a good idea, but that could be another post).

screensht_nag

We ended up getting a new Challenger 3000 Liebert (Emerson Power) HVAC unit in our data center recently.  We typically monitor everything using the Nagios system for our servers and we were pleased to find that inside the Liebert toward the top was a component that they refer to as the “Unity” module.  After reading some online user guides I was able to bind an IP to it and start querying it via SNMP.  Hint: the default username and password to get in to the web interface were both “Liebert”.  After looking around for a bit, I realized there weren’t any stock commands in Nagios via the check_snmp plugin to handle this, so I added some of my own.  Using snmpwalk, I was able to determine which of the OIDs I was interested in and made some custom command definitions.

Here’s the command definitions:

##########################################
# ‘snmp_lbenv_humidity’ command definition – consider anything under 21 percent critical
define command {
command_name    snmp_lbenv_humidity
command_line    $USER1$/check_snmp -H $HOSTADDRESS$ -C $ARG1$ -o .1.3.6.1.4.1.476.1.42.3.9.20.1.20.1.2.1.5028 -l ‘\Return Humidity\’ -u ‘\%\’ -c @0:20.9 -w @21:35
}

# ‘snmp_lbenv_returnairtemp’ command definition – critical at 24 or more degrees Celcius
define command {
command_name    snmp_lbenv_returnairtemp
command_line    $USER1$/check_snmp -H $HOSTADDRESS$ -C $ARG1$ -o .1.3.6.1.4.1.476.1.42.3.9.20.1.20.1.2.1.4291 -w 23 -c 24 -l ‘\Return Air Temp\’ -u ‘\Celcius\’
}

# ‘snmp_lbenv_hvacstatus’ command definition
define command {
command_name    snmp_lbenv_hvacstatus
command_line    $USER1$/check_snmp -H $HOSTADDRESS$ -C $ARG1$ -o .1.3.6.1.4.1.476.1.42.3.9.20.1.20.1.2.1.4123 -l ‘\HVAC Status\’ -u ‘\Normal vs Abnormal\’ -s ‘”Normal Operation”‘
}

##########################################

I also set up nagiograph plugin in order to give me a quick historical overview of the changes in temperature and humidity.

HVAC

Pretty neat way to monitor the Liebert without having to set up anything additional!

I was stumped for a while trying to figure out how to provide a Git repo via HTTP(s) in order to allow a separate group of ldap authenticated users to have read-only access to each individual repos while another group in A/D has full read-write access.  Here’s what I finally came up and included in my apache’s conf file to make it work:

<Location /git/MyGitRepo>
Require ldap-group CN=MyGitRepoRO,OU=Git Security Groups,OU=Organizational Units,DC=ds,DC=dinkyuniversity,DC=edu
</Location>

<LocationMatch “^/git/MyGitRepo/git-receive-pack$”>
Require ldap-group CN=MyGitRepoRW,OU=Git Security Groups,OU=Organizational Units,DC=ds,DC=dinkyuniversity,DC=edu
</LocationMatch>

As you can see above, basically the trick I figured out was to limit access for the “git-receive-pack” command for a separate group of people needing the read-write access.  Users needing RW access must also exist in the RO group as well.

At some point in time late in March 2013, an update to my Mac broke the ldapsearch functionality.  I had a simple script written with a menu that would allow me to query the school’s directory for commonly needed info such as usernames, phone numbers, departments and so on.

Everything worked wonderfully until last month I started receiving this error:

ldap_sasl_bind(SIMPLE): Can’t contact LDAP server (-1)

After a lot of googlin’ most people receiving this error suggested adding either of these to my ldap.conf file

TLS_REQCERT    never
or
TLS_REQCERT     allow

Unfortunately, neither of these made any difference.  How frustrating.  After a while I came to the realization that the ldapsearch was not longer looking at the configuration file in the standard location /etc/openldap/ldap.conf

On the Mac, using the dtruss command (similar to strace), I was able to track down where it was looking for the file by a command similar to this:

sudo dtruss -a ldapsearch [rest of the query here] 2>&1 |grep conf

which gave me what I was looking for…
346/0x2f28:    247865   12423    152 open_nocancel(“/opt/local/etc/openldap/ldap.conf\0″, 0x0, 0x1B6)         = 3 0

No file existed there yet, so a simple symlink to my original configuation file fixed my ldapsearch!

sudo  ln -s /etc/openldap/ldap.conf /opt/local/etc/openldap/ldap.conf


Server temperature graphic

I had an issue where at one of my remote offices an air handling unit was failing and the server room was heating up far beyond the recommended operating temperature. There were people working in that remote office, but I couldn’t rely on them to check on it daily and nobody was there over the weekends. I looked around and there were a few different devices and software products for monitoring temperature, but some were quite expensive.

I decided to play around and see if I could get a method working where I could monitor the temperature using something built-in and basic. I had read that most Dell servers have temperature probes that monitor air temperature for ambient air as well as planar (off the CPU/motherboard) and would make that available to the SNMP service specifically within the MIB-Dell-10892 specification.

I was surprised to find out how easy it was to set up SNMP and MRTG to poll the server and provide me with the readings I was looking for! Here’s how I did it:

First on the server, I enabled the SNMP service. It was a Windows server, so it was as simple as going to Start > Control Panel > Add/Remove Programs > Add/Remove Windows Components > Management and Monitoring Tools > [Details] > Select “Simple Network Management Protocol” to install it. Then to make sure there was a reasonable level of security, I went to the Services applet, found the SNMP Service and chose a READ ONLY community string and specified the IP of my monitoring host under the Security tab. I made sure the service was started.

Then I made sure to allow the UDP 161 and UDP 162 ports associated with SNMP were allowed through the firewall.

Next I put in the following settings into my MRTG configuration file. To tell you the truth, the hardest part was determining the calculation and syntax in order to get it to convert from Celcius to Farenheit!  Be sure to replace my IP and snmp community string with the IP and community string of your host in the configuration file settings.

################################################
WorkDir: /var/www/mrtg
### Measure Planar and Ambient Temps
#—————————————————————
Target[10.1.100.100.temp]: 1.3.6.1.4.1.674.10892.1.700.20.1.6.1.1&1.3.6.1.4.1.674.10892.1.700.20.1.6.1.2:readonlycommunitystring@10.1.100.100 / 10 * 1.8 + 32
MaxBytes[10.1.100.100.temp]: 150
Title[10.1.100.100.temp]: Planar and Ambient Temperature – Remote Server
PageTop[10.1.100.100.temp]: <H1>Planar and Ambient Temperature – Remote Server</H1>
Options[10.1.100.100.temp]: gauge, integer, nopercent
YSize[10.1.100.100.temp]: 220
YTics[10.1.100.100.temp]: 11
YLegend[10.1.100.100.temp]: Temp degrees F
ShortLegend[10.1.100.100.temp]: deg F
Legend1[10.1.100.100.temp]: Temperature1
Legend2[10.1.100.100.temp]: Temperature2
Legend3[10.1.100.100.temp]: Legend3
Legend4[10.1.100.100.temp]: Legend4
LegendI[10.1.100.100.temp]: MotherBD Temp 1:
LegendO[10.1.100.100.temp]: Ambient Temp 2:
###################################################